Transform your business data into actionable insights.
We clean, organize, automate, and visualize your business data using Excel, Power BI, and AI — so you can focus on growing your business.
Why businesses trust Analytiqo Technologies
26+ yrs corporate experience
Accurate results
Confidential handling
Fast delivery
Dedicated support
AI + human validation
Services built around real business decisions.
One-time projects or monthly reporting support. Pick what fits — we take care of the rest.
Data cleaning & consolidation
Merge scattered files, remove duplicates, and standardize formats into one reliable source of truth.
Power BI dashboards
Interactive, decision-ready dashboards with drill-downs, filters, and refreshable data models.
Excel dashboards & MIS
Beautiful, dependable Excel dashboards and MIS reports your team will actually use every day.
Power Query & automation
Automate repetitive reporting with Power Query, macros, and templated workflows — save hours weekly.
KPI & business reporting
Sales, finance, HR, operations — tailored KPIs that map to how your business actually runs.
AI-assisted analysis
AI-powered workflows validated by 26 years of business judgement, not black-box guesses.
A calm, four-step process. No surprises.
Understand your requirement
A short discovery call to align on goals, data sources, and the decisions you need to make.
Clean & prepare data
We consolidate files, fix duplicates, and build a clean, refreshable data foundation.
Build dashboards & reports
Excel or Power BI dashboards, MIS reports, and automations designed for your workflow.
Deliver insights & support
Handover with training, documentation, and ongoing monthly support if you need it.
What changes for you, from week one.
Save hours every week
Reclaim time lost to manual reports.
Make faster decisions
Live dashboards, always up to date.
Reduce manual work
Automations handle the repetition.
Eliminate reporting errors
Validated numbers you can trust.
Professional dashboards
Board-ready visuals, out of the box.
Better business visibility
See what's working, and what isn't.
A different kind of data partner.
Clear numbers. Beautiful surfaces.
A few examples of the dashboards we build for sales, finance, MIS, and operations teams.
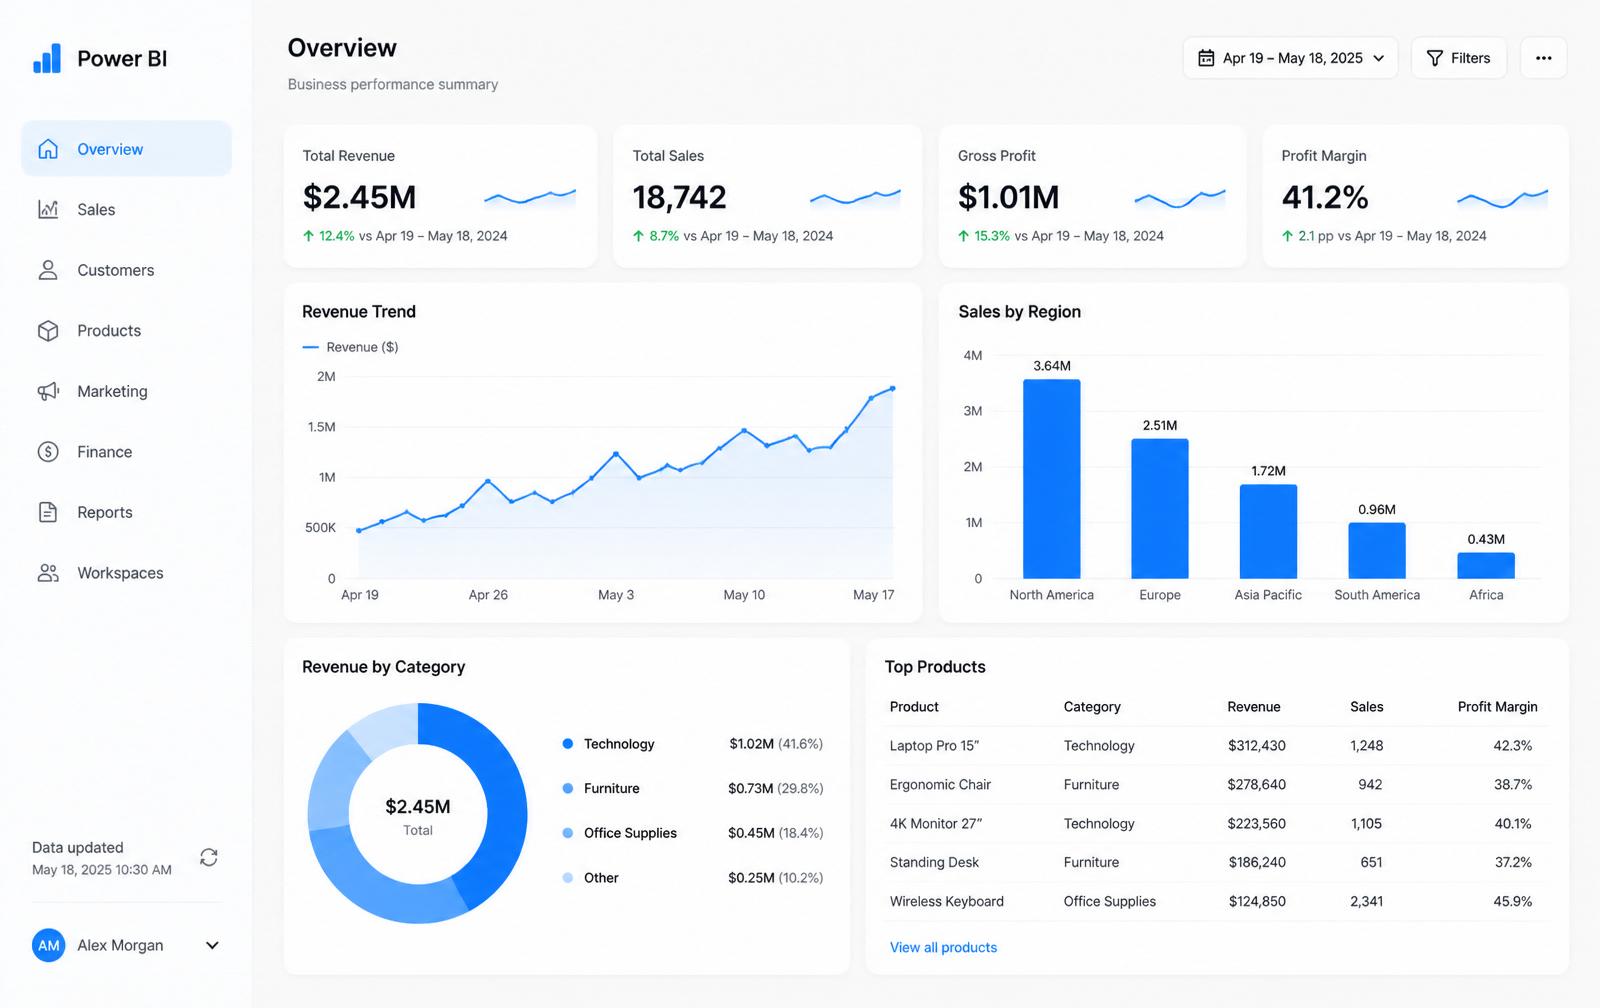
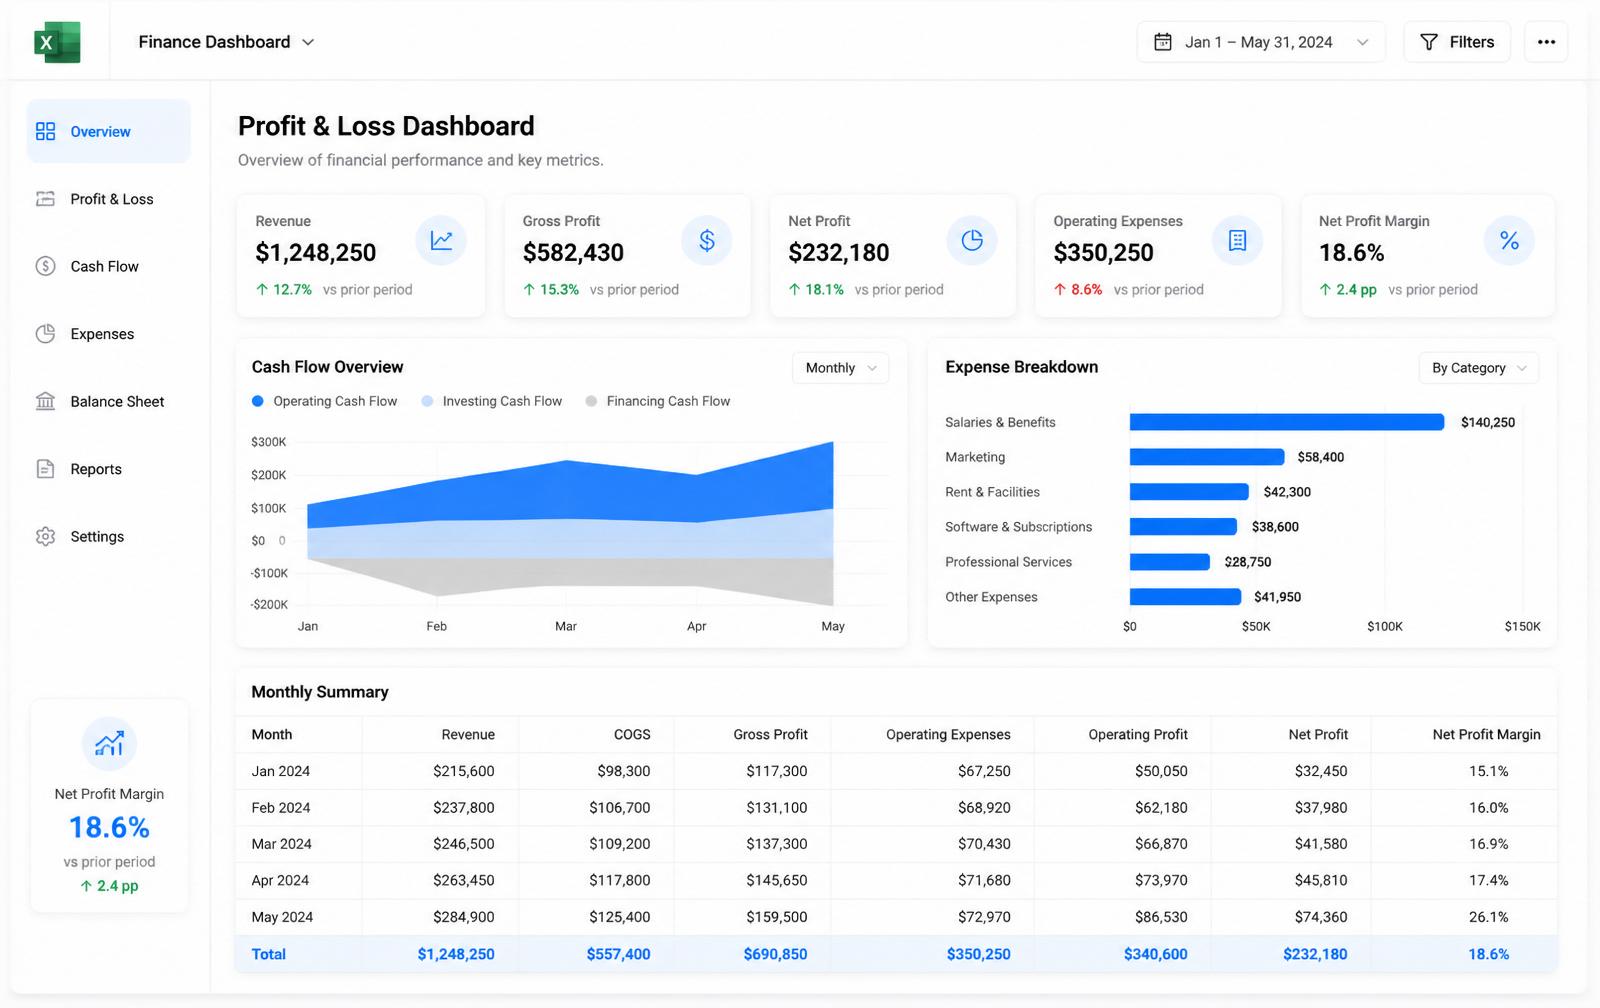
Finance & P&L
Excel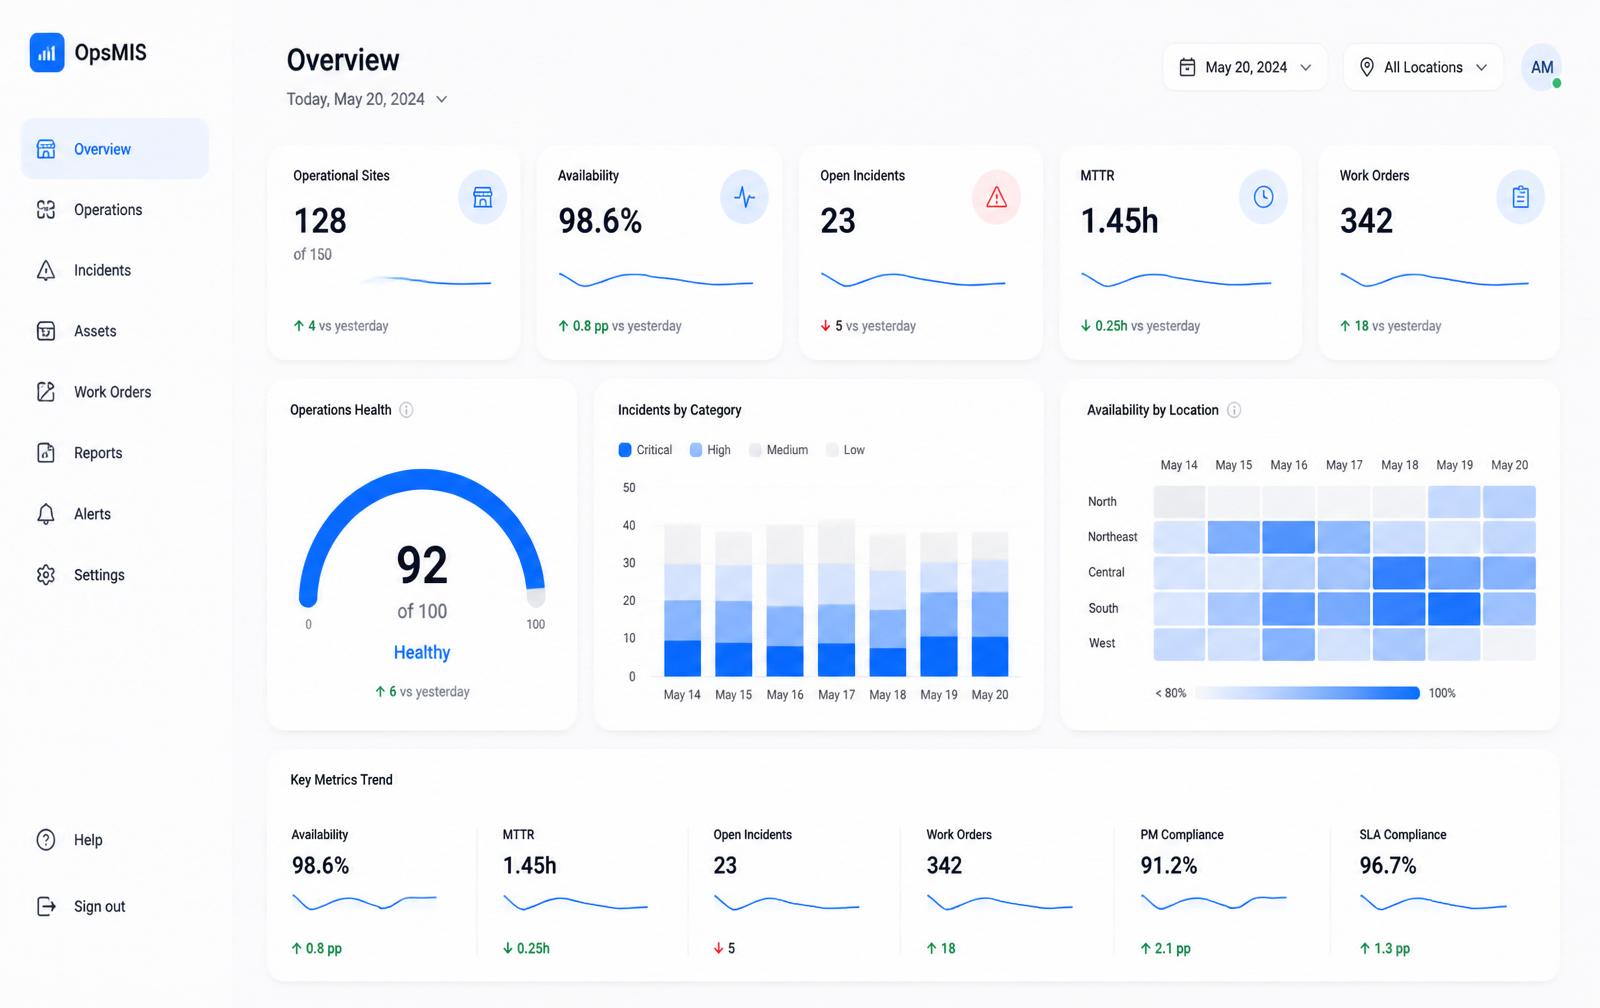
Operations MIS
Power BIPrajith M C. 26 years of solving real business problems with data.
Commerce Graduate with over 26 years of corporate experience. Throughout my career I've solved real business problems using data. Now I help businesses save time by transforming raw, messy data into meaningful dashboards and reports — combining manual expertise with AI-powered workflows.
- 26+ years corporate experience
- Commerce Graduate
- Deep business understanding
- Quality, ethics & client success
Sample testimonials. Yours goes here next.
* Placeholder testimonials — replaced with real client quotes on request.
“We stopped chasing branch reports every Monday. One dashboard, always current.”
Operations Head
Retail chain
“Our finance team saved close to 12 hours a week. The MIS looks like something a big firm would build.”
Finance Manager
Manufacturing
“Clear, honest, and fast. Exactly the kind of professional we needed.”
Managing Partner
CA firm
Answers, before you ask.
Still curious? Send a note — we reply personally.